by Joe Melton
According to the U.S. Department of Energy (DOE), pumping systems account for about 25% of annual motor systems electrical energy consumption at most industrial plants and up to 50% in other pump-intensive industries. As such, the optimization of pumping systems can reduce a typical facility's pumping system energy costs by over 20% a year — a significant savings for any company operating in today's economic climate.
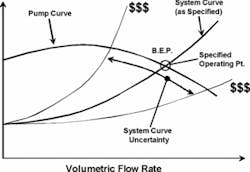
Figure 1
In addition, given the varied and extreme uses of water in industrial applications, heightened pump system efficiencies can also significantly impact facility operating costs as well as produce additional life cycle cost savings through reduced maintenance needs, improved system reliability, enhanced process control and extended product quality.
This is why management, operations and engineering professionals working in industries that use pumps need to fully understand both the energy and economic potential of pumping systems optimization and their facility's pumping system network. In most cases, this includes:
- Realizing that pump and motor efficiencies play key roles in minimizing energy consumption.
- Properly applying speed controls to significantly reduce peak operating costs and improve overall system response.
- Using life cycle cost (LCC) analyses and efficiency testing to benefit all parties involved with pump system activities at water treatment plants.
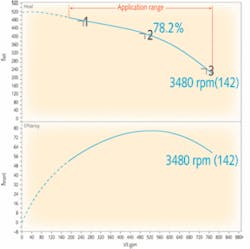
Figure 2
Pump System Life Cycle Costs
LCC analysis takes into consideration the costs to purchase, install, operate (including energy costs), maintain, and dispose of all components of the system. Used as a comparison tool of possible design and overhaul alternatives, this analysis offers a way to predict the most cost-effective solution. While LCC doesn't guarantee a particular result, it also permits plant personnel to make a reasonable comparison between alternate solutions within the limits of available data.
Most water facility pumping systems will have life cycle costs dominated by energy and maintenance costs. It's thus important to accurately determine the current cost of energy, expected annual energy price escalation for the estimated life, and expected maintenance labor and material costs. Other elements, such as lifetime costs of downtime, decommissioning and environmental protection, can often be estimated based on historical data for the facility.
Mechanical pump failures for industrial users often result in a production shutdown costing hundreds of times more than the cost of the repair of the pump. Many mechanical failures are caused by shaft deflection, which causes premature failure of bearings, seals and other components. Shaft deflection can be lessened by reducing the distance between the bearings and impeller (shaft overhang) and by using the slowest practical motor speed.
A well-designed distribution system can affect pumping requirements, potentially allowing for selection of a smaller pump and motor, thereby reducing both initial purchase costs and life cycle costs. Once in operation the system should be operated as close to its "Best Efficiency Point" (B.E.P.) as possible (see Figure 1). Maximizing efficiency also maximizes system reliability.
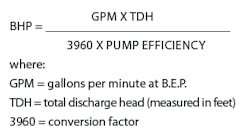
As pump operation moves away from the B.E.P., the energy and maintenance costs will increase and the expected life of the pump will be reduced. One measure of pump motor efficiency is Brake Horespower (BHP), also known as Water Horsepower (WHP). A simple calculation can be made to determine BHP:
From this equation, it can be seen that a pump efficiency difference of just a few percentage points (e.g., 74% vs. 80%) can have a big impact on pumping power requirements and energy use. It's critical then to not only install the most efficient pump, but also to match the pump performance accurately to the pump system curve.
Pump Efficiency Testing
In addition to LCC measures, another way to positively impact pump system performances is through the use of efficiency tests that can help engineers and operations personnel to identify inefficient systems, determine energy efficiency improvement measures, and estimate potential energy savings.
In most cases, these tests are usually conducted on larger pumps and on those that operate for long periods of time. For instance, flow rates can be obtained with reliable instruments installed in the system or preferably with stand-alone tools such as a sonic (Doppler-type) or "transit time" flow meter or a Pitot tube and manometer. Turbulence can be avoided by measuring the flow rate on a pipe section without fittings at a point where there is still a straight run of pipe ahead.
In addition, internal leaks caused by excessive impeller clearances or by worn or misadjusted parts can reduce the efficiency of pumps. Corrective actions include restoring internal clearances and replacing or refurbishing worn or damaged throat bushings, wear rings, impellers, or pump bowls. Changes in process requirements and control strategies, deteriorating piping, and valve losses all affect pumping system efficiency.
Over time, a pump's efficiency can degrade as much as 10-25% before it's replaced, according to a study of industrial facilities commissioned by the DOE, and efficiencies of 50-60% or lower are quite common. Because these inefficiencies aren't readily apparent, though, opportunities to save energy by repairing or replacing components and optimizing systems are often overlooked. Several suggested actions for increasing pump system efficiencies include identification of:
- Misapplied, oversized, or throttled pumps, or those that have bypass lines
- Pumps with operating points below the manufacturer's pump curve (if available)
- Systems with flow rates of 30% or more from the BEP flow rates, or with system
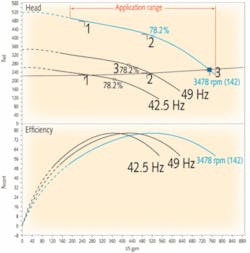
Figure 3
Conclusion
The industrial water industry must not only realize the value of optimized pumping systems, but also that there are numerous resources available to them which can help lower pump system energy use and improve bottom-line profitability. In fact, there are also many savings programs and attractive paybacks for companies seeking to improve motor-driven system efficiencies, especially with pumps.
For example, many energy efficiency organizations and state and federal government agencies are currently offering industrial pump users incentives and/or rebates to optimize pump systems for energy saving purposes. This includes free energy assessments, rebates on energy efficient equipment, and use of renewable energy resources, business tax credits and exemptions, project grants, equipment loans and financing programs.
As an ongoing resource to these efforts, industrial water companies are urged to visit www.PumpSystemsMatter.org and review the valuable resources available on the website. Pump Systems Matter™ (PSM) was launched in 2006 by the Hydraulic Institute to help North American pump users gain competitive business advantages through strategic, broad-based energy management and pump system performance optimization.
About the Author: With over 20 years experience in the design and application of pumps, controls and various water and wastewater treatment equipment, Joe Melton is products/marketing manager at Wilo-EMU USA, of Thomasville, GA. He has worked as an estimator for a mechanical contractor, as a piping systems design engineer, as a sales engineer and sales manager for manufacturers' representative firms, and now for a pump manufacturer. As a charter sponsor of Pump Systems Matter, he and his company have worked actively with PSM to develop and market tools and information that integrate pump system performance optimization and efficient energy management practices into normal business operations. Contact: 973-267-9700 x22 or [email protected]
Efficiency Example
An industry uses a centrifugal pump to pump 750 gpm of process water from a reservoir to three applications in its process. The 3 applications aren't in constant use: 70% of the time, two of these applications are in use; 5% of the time, only one is in use; and 25% of the time, all three are in use. The application is wash down and they must guarantee 85 psi water available at all times.
Assuming the elevation lift might be 25 feet and allowing for piping losses, the system curve might look like:
- 0 gpm @ 25 ft plus 85 psi = 221 ft
- 250 gpm @ 226 ft
- 500 gpm @ 236 ft
- 750 gpm @ 250 ft
From the pump curve, the significant points are:
- 250 gpm at 476 ft and 61% hydraulic efficiency
- 500 gpm at 416 ft and 78% hydraulic efficiency
- 750 gpm at 250 ft and 62% hydraulic efficiency
Obviously, the pump is adding more pressure than required at lower flows and might require pressure reducing valves for the lower flow conditions. Using the operating schedule listed above and a motor efficiency of 80%, the pump will draw an average of 64.1 kW or 512.7 kW-hr per 8 hour shift. Now, let's look at the same pump on a variable speed control system.
SEE FIGURE 3
Putting that same pump on a variable frequency drive (VFD), the same duty points are:
- 250 gpm at 226 ft and 71% hydraulic efficiency
- 500 gpm at 236 ft and 76% hydraulic efficiency
- 750 gpm at 250 ft and 62% hydraulic efficiency
By matching requirements of the conditions and using the same assumptions as above plus a 97% efficiency for the VFD, the same pump would draw an average of 45.7 kW or 365.3 kW-hr per 8-hour shift. This represents a direct energy savings of 28.7% to accomplish the same job with the same pumps. An alternate solution would be to use multiple constant speed pumps.
