Water quality analysis and testing in mega desalination plants
Industry and municipal water supply depend more and more on desalinated or treated water to meet day-to-day demands. On one hand, municipal water supply has tremendous importance because it is supplied to the residents, and its quality has to be continuously monitored to assure it meets the quality requirements. On the other hand, industrial water users utilize water in their manufacturing processes, and poor water quality can affect, and even damage, quality of production and create great losses.
Both sectors depend on reliable and stable water quality over time, 24 hours per day, 365 days per year. Water treatment and desalination plants require much more than monitoring the water quality of the final product to meet these challenging conditions.
Today’s business requirements demand improving processes, all while lowering costs. For water treatment plants, this means more reliable and stable operations with minimal human resources.
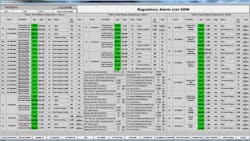
One control philosophy for mega plants is based on the autopilot principle of controlling the production, whereby operator involvement has shifted chiefly to the job of quality controller. The operator selects the required production target and operational parameters and lets the control system do the rest.
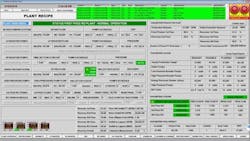
An example of this is shown in Figure 1 (a typical plant recipe screen). This means the world’s largest seawater reverse osmosis (SWRO) plants can be operated with only two operators per shift.
Figure 1. Typical recipe screen of a mega SWRO desalination plant
This method that creates the set of minimum required parameters (MRP) is applicable for engineering, procurement and construction and operations and maintenance (O&M). It is based on long-term operational experience in more than 400 thermal and reverse osmosis (RO) plants during the last 50 years.
Feed parameters
Current regulations require not only quality monitoring of the final product, but also of the feedwater parameters and the disposal water. In addition, the feedwater quality has to be monitored continuously to anticipate any changes in the feed quality that may affect production capacity or plant operation.
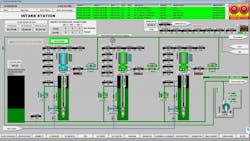
Typically, feedwater parameters are temperature, conductivity, redox, total organic carbons, turbidity and pH. Regulators can also control the online total dissolved solids (conductivity), pH, and turbidity of the discharged brine, as shown on the intake screen in Figure 2.
Figure 2. Online analytical measurements at the seawater intake station
The feedwater quality’s online parameters are examined according to the MRP method to allow the plant’s O&M team to react and update operation setpoints, production capacity, chemical dosing, filter backwash frequency and even anticipate further actions.
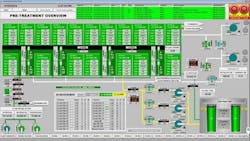
This method does not only take into account the source water parameters, but also the quality of the treatment measured in-process. Continuous filtration performance monitoring by silt density index (SDI), turbidity measurements and filter operation lifespan are important indicators of the pretreatment performance (see Figure 3).
Pretreatment performance monitoring
Furthermore, plant operational costs rely on minimization of chemical use versus uncontrolled changes in water quality and parameters. Because temperature, conductivity, pH and turbidity all affect operational costs, it is important to implement a well-developed policy of what to measure, how to measure, at what frequency and how to create correct automatic warnings, alarms and actions, and trips. These parameters are then made accessible to the operator to increase awareness of the potential impact. Figure 4 displays the quality alarm and interlock parameters and their impact on plant operation.
Figure 4. Intermediate and final alarm/interlock parameters and their impact
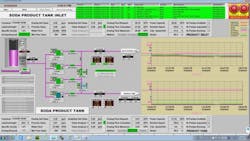
These automatic warnings are important for instances in which the control system is unable to cope with the process requirements and needs operator intervention. In normal conditions, the control system manages the variations in flow and source water parameters. Since water parameter margins are often very thin, a common control principle is a cascade of PID controls, e.g. soda-dosing control is according to the measured pH value. The problem is often that there is a considerable lag between the dosing correction and the actual effect, which can result in substantial undershooting or overshooting of the PID controller, causing the water parameter to be out of specification.
Since the dosing rate (in ppm) of soda under stable conditions can be empirically established, the first PID loop can now be configured by dosing flow, according to the empirical established dose. The second PID controller monitors the infield pH analyzer and adjusts the pH indirectly by adding or subtracting a limited value to the main ppm set value. The adjustment is also monitored to verify its effect and can be suspended to prevent undershooting and overshooting. The product water pH control shown in Figure 5 is based on this principle.
Figure 5. Cascade PID control to prevent undershooting or overshooting.
A poorly automated control or control that is heavily dependent on the operator can result in water parameters being regularly out of spec, causing loss of revenues. Lost production can be amplified by the operator’s inexperience or judgement, leading to numerous alarms, which then tend to be ignored due to the quantities and frequency. The operator may even bypass the interlocks since it becomes nearly impossible to operate the plant, resulting in equipment damage and more problems for the team.
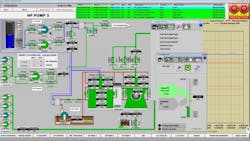
Intermediate parameters are selected to protect equipment or the process in general. These are not limited to the water quality but affect the plant as a whole. Parameters (for example, vibration, temperature, flow, suction/differential/discharge pressure) have to be monitored continuously to prevent long-term and short-term equipment damage. These parameters are also used as important indicators for preventive maintenance.
Figure6. Operational parameters monitoring a 5.5 MW high-pressure pump
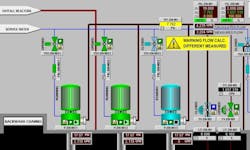
These parameters are selected in conjunction with the equipment protection and process parameters to generate corrective actions by the automated control system, the interlock protection system and SCADA alarm module. Pump efficiency is monitored online by sophisticated programing (see Figure 6), while monthly expert analysis enables predictive actions and minimizes unexpected maintenance. For example, Figure 7 shows the comparison between the calculated pump head and flow against the measured flow and alarms when a significant loss of measured performance occurs.
Figure 7. Pump performance monitoring
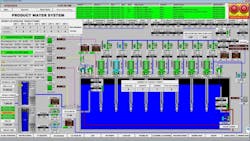
Final water quality parameters are selected to assure warranted water quality is met for all conditions. It is also used to create relevant alarms for the operators and control system (see Figure 8).
Figure 8. Final water quality parameters at the product water system
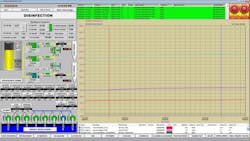
Water quality monitoring can go beyond direct, infield analytical measurement. For example, effectiveness and reliability of chemical disinfection is determined by the ratio between contact time and disinfectant and calculated online based on various infield process measured parameters Giardia and virus ratio alarms and interlocks (see Figure 4) are based on these calculations.
Figure 9. Final water disinfection monitoring
Critical parameters are examined based on hazard operation analysis (HAZOP) during the stage of detail design. Further, the criteria of two out of three instrument monitoring is used only on those parameters that can create a significant impact on plant operation to ensure the highest system availability and reliability.
Management information systems
Management information systems (MIS) based on historical plant data provide proper follow up on plant operation and long-term optimization based on seasonal variations.
The automatic report generation add-on utility creates controlled document generation and distribution, both to internal and external stakeholders. Daily and monthly plant performance reports are automatically sent to water authority regulators, plant owners and plant operators. The computer maintenance management system (CMMS) assists the maintenance team in managing preventative maintenance, minimizing unpredicted equipment failure and includes a rich database on plant equipment data.
Summary
This strategy has been tested by many years of operation in industrial and municipal plants around the world and the system safely minimizes water costs. The strategy involves all the related disciplines:
- Process parameter selection
- Instrument selection
- Alarm and interlock definitions
- System integration, (plant control design, programming and SCADA development)
- Real-time signaling, controlling, alarming and data acquisition
- SCADA platform, which includes online:
- Efficiency measuring and comparison
- Normalized RO membrane parameter monitoring
- Troubleshooting
- MIS historical data collection, automatic report generation and distribution
- CMMS involving:
- Periodic monitoring of pump parameters
- Maintenance schedules of other equipment
- Optimization of plant operation
Selecting the correct parameters to monitor is crucial to achieving the desired final target of minimum long-term water costs. Excessive instrumentation can harm operation and create higher overall costs.
All internal images courtesy of IDE Technologies
Frits van Rooij
Frits van Rooij is a senior instrumentation and control engineer for IDE Americas. He also serves as a system integrator and a lead engineer of functional design of the control systems where he has been involved in nearly all SWRO desalination plants for IDE at several thermal plants. Frits has a wide experience dealing with in-field measurement and plant control and serves as OT manager at the Carlsbad Desalination Plant in California. He can be reached at [email protected] or 760-795-3544.
Miriam Faigon
Miriam Faigon is senior director products and solutions for IDE Technologies where she is responsible for defining the product lines and product technical definitions according to market trends and sector/segment needs. She has gained technical experience in water treatment with a focus on membrane-based desalination and treatment systems – with specific expertise in coagulation, filtration, flotation, sea- and brackish water reverse osmosis processes, boron removal, post-treatment, product water potabilization, detailed process engineering, sequence of operation, plant commissioning, process optimization, and engineering management – through the design, commissioning and operation of all mega desalination plants of IDE during the last 20 years. She can be reached at [email protected] or 972-9-892-9768.
